

Live Debugging Python Applications
Speed up finding the root cause and minimize the impact of such incidents


Table of contents
- Importance of Debugging in Production Environments
- How to Integrate Sidekick with Python Applications
- Step 1 — Create a Sidekick account
- Step 2 — Install sidekick-agent-python to your application
- Step 3 — Connect the application to Sidekick web IDE
- Step 4 — Enabling Tracepoints
- Debugging with Sidekick
- Using Conditional Tracepoints in Sidekick
- Conclusion
A few months back, I read an interesting story where astronauts in the International Space Station had to abandon a mission and seek shelter due to a cloud of orbital debris. According to an article by National Geographic, it is a result of Russian anti-satellite missile testing (Nudal ASAT), performed live for the first time on an actual object in orbit.
This incident made me think of how things can act differently in production compared to development and testing environments. As developers, we often face these unexpected scenarios. And sometimes it is impossible to recreate them locally to find solutions.
However, having a standard live debugging mechanism in production will significantly speed up finding the root cause and minimize the impact of such incidents. So, in this article, I will discuss how we can use live debugging in Python applications to give you a better understanding.
Importance of Debugging in Production Environments
As we all know, testing is an essential part of the development process before releasing into the production environment. Especially modern applications go through extensive manual and automatic testing processes to identify potential bugs.
However, its hardly possible detect all issues prior to production since these environments have differences from one another. For example, there are errors, caused by data, access patterns, load in production is difficult to replicate identically in development and testing environments. Therefore, we have to debug such errors in the production.
As developers, we must be aware of different tools and approaches we can use for remote debugging to improve efficiency. Sidekick, is one such tool that provides a web IDE & IDE plugins for real-time application debugging. So, let’s see how we can use Sidekick with Python.
How to Integrate Sidekick with Python Applications
In this article, I will be creating a simple Python application with distributed microservices using Flask. Then, I will connect it to the Sidekick web IDE and discuss how to use it for live debugging for Python applications.
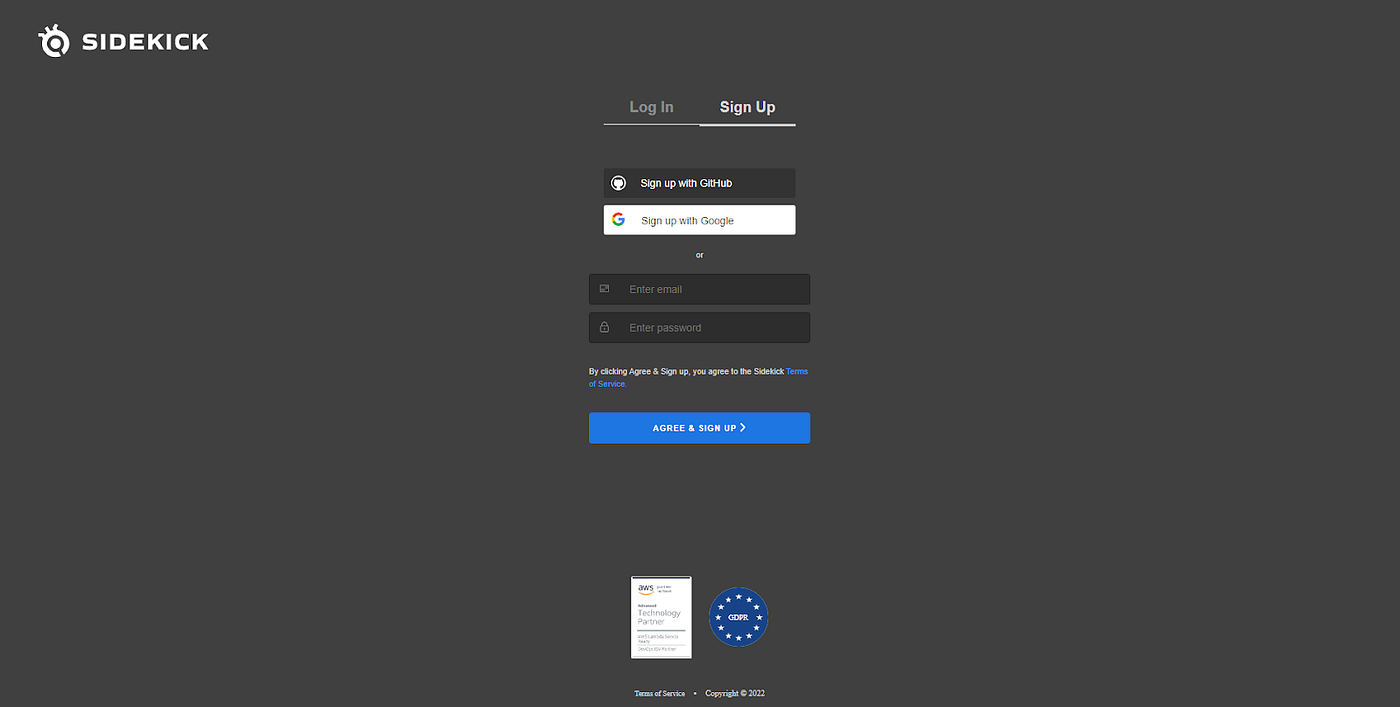
Step 1 — Create a Sidekick account
As the first step, you need to create a Sidekick account. After that, you can easily signup with Sidekick using your Google or GitHub account.
Step 2 — Install sidekick-agent-python to your application
After creating your Python project, you need to install sidekick-agent-python to connect the application to Sidekick.
pip install sidekick-agent-python
Then, you need to configure the environment variables. Sidekick requires the following as environment variables, and you can use a .env file to include them.
SIDEKICK_APIKEY= <API-KEY>
SIDEKICK_APPLICATION_NAME= POST_APP
SIDEKICK_APPLICATION_STAGE= PROD
SIDEKICK_APPLICATION_VERSION= 1.0.0
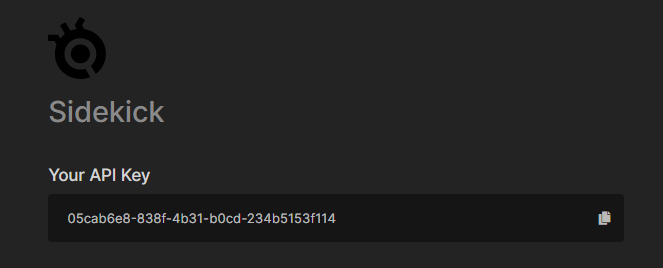
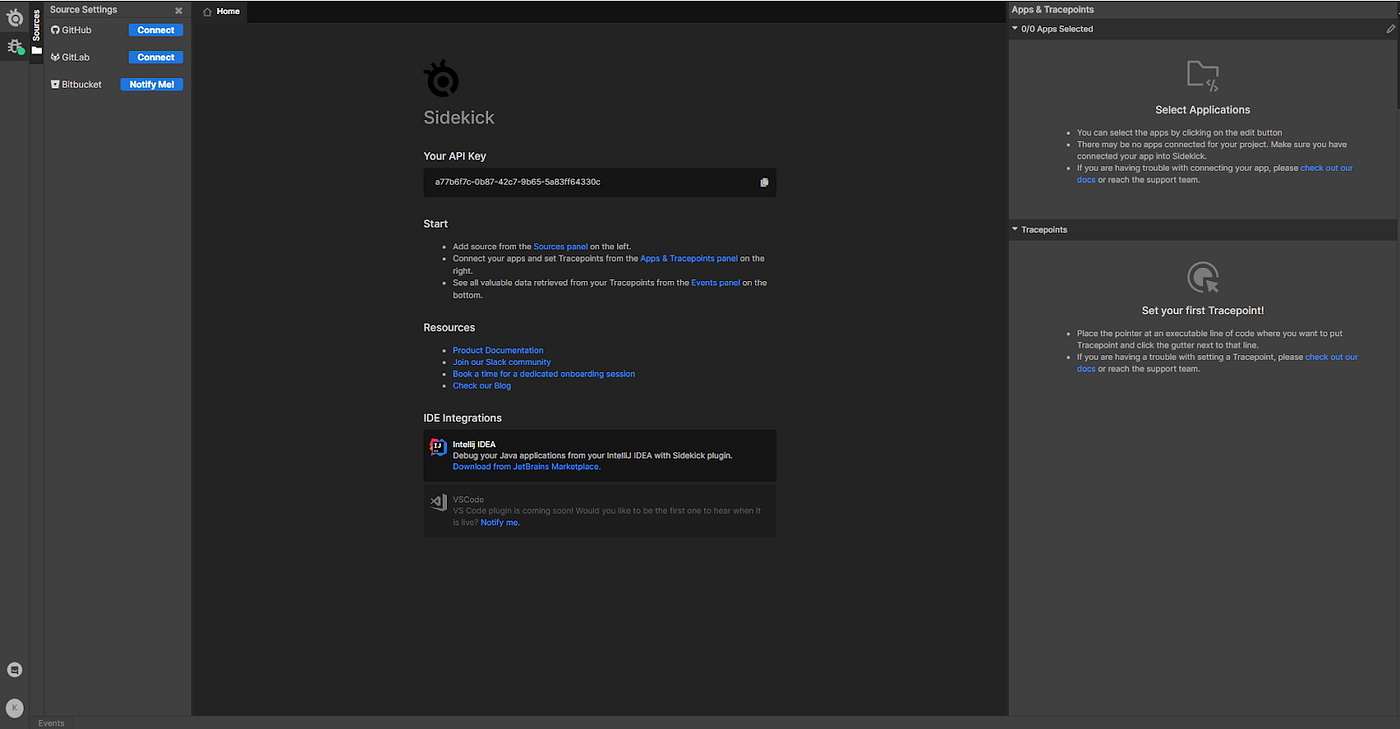
You can find SIDEKICK_APIKEY on the home page of Sidekick IDE.
Finally, you can add Sidekick to your application and enable tracing as follows:
from pathlib import Path
from dotenv import load_dotenv

env_path = Path(<.env file path>).resolve()
load_dotenv(dotenv_path=env_path)

try:
    import tracepointdebug
    tracepointdebug.start()
except ImportError as e:
    pass
Step 3 — Connect the application to Sidekick web IDE
Sidekick allows you to connect GitHub, GitLab, and Bitbucket repositories directly to the web IDE. You can use the source tab in the IDE to select your repository.
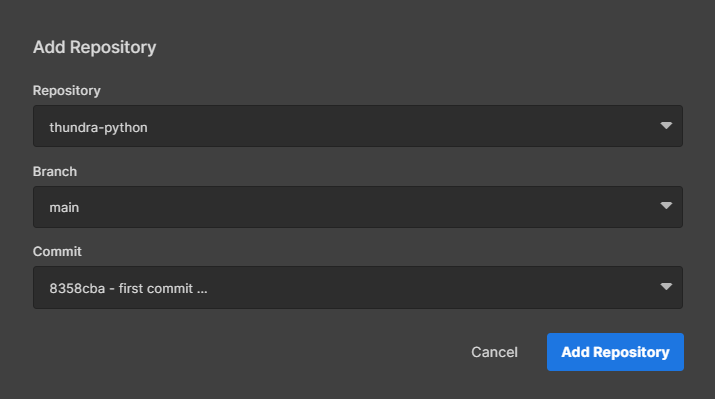
Most importantly, you don’t need to worry about the security of your repository since Sidekick will only have read access to your source code, and it will never fetch the code into their servers.
Step 4 — Enabling Tracepoints
After connecting the Git repository, you need to connect your application to Sidekick IDE and enable tracepoints. At the Applications tab you will see a list of applications that use your Sidekick API key.
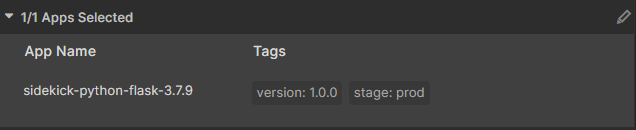
Please note that your application must be running to get listed in the Applications tab.

Then, you can create tracepoints (non-breaking breakpoints) in the Sidekick editor, and all the tracepoints will be listed in the Tracepoints tab.
That’s it. You have successfully integrated Sidekick for your Python application. Now, you can start monitoring the application using tracepoints.
Debugging with Sidekick
As mentioned, Sidekick tracepoints are a type of nonbreaking remote breakpoints. Tracepoints do not pause your codes as normal breakpoints, and they can also work with Thundra’s distributed technology to enable connections between several tracepoints in a transaction.
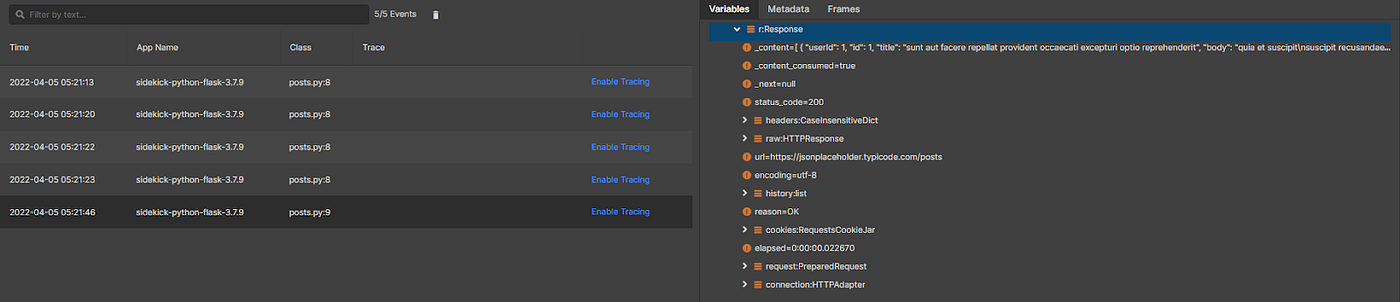
After enabling tracepoints, Sidekick will automatically start collecting snapshots of the local variables when the application execution passes that tracepoint. You can find those events in the Sidekick Events tab and filter them by any text or distributed trace IDs.
The above image shows the tracepoint events of the posts service in the example application.
However, taking snapshots every time, even without any issues, might not be the ideal approach. Sidekick provides conditional tracepoints to overcome this issue, and you can enable a tracepoint based on a specific condition you define.
Using Conditional Tracepoints in Sidekick
Although the posts service of the example application worked as expected, the user service didn’t return the expected response. Instead, it returned an empty response when the get users endpoint is invoked. So, let’s place a conditional tracepoint in Sidekick IDE to trigger to find the reason for this behavior.
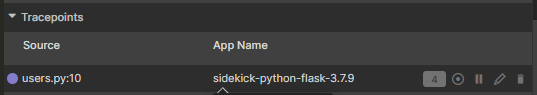
You have to pick the tracepoint you need to edit from the tracepoint list and click the edit icon to enable conditional tracepoints.
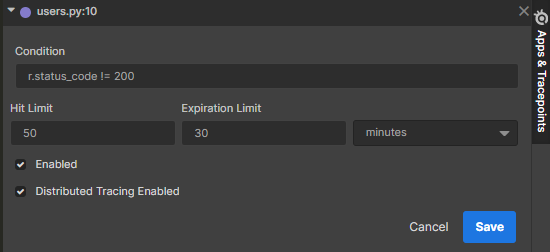
It will open a new window like below, where you can define the condition. In this example, the following tracepoint will only take snapshots if the response status code is not equal to 200.
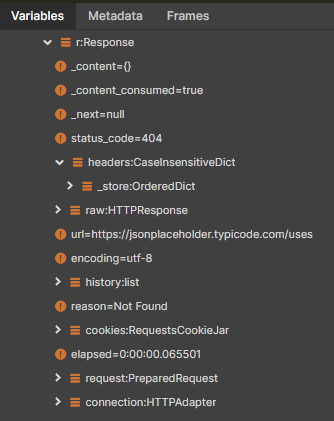
You need to rerun your application and explore the tracepoint snapshot to get more details.
As you can see, the response code for the API request is 404, and the reason is Not Found. It means that the application can not find the API we are calling. So, there must be an error in the API path. Likewise, you can easily use Sidekick IDE to monitor and debug issues with your production-level applications easily.
Besides, Thundra provides a trace map feature where you can visualize the high-level components in your application and trace its behavior in real-time. It helps to identify issues that span across components and identify what’s causing them. For that, you need to integrate the Thundra APM agent. You can find more details about that in Thundra documentation.
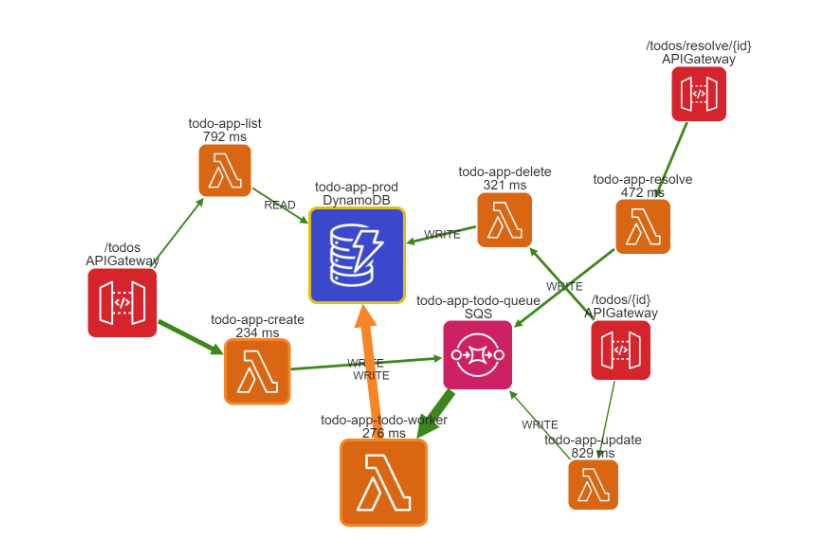
Tracemap of sample ToDo app configured with Sidekick & Thundra
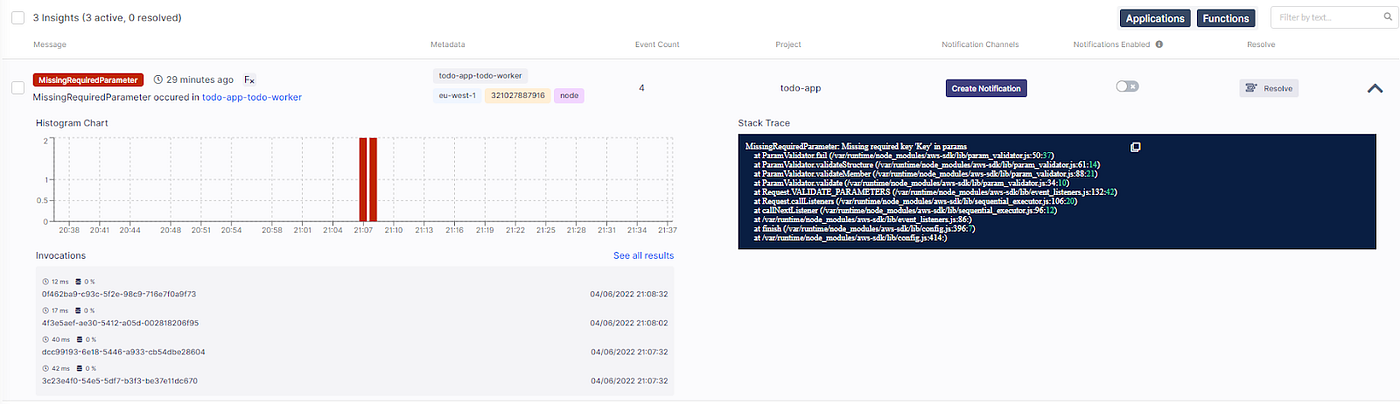
Live Stack Tracing using Sidekick Sidekick & Thundra
The images below show a trace map of a sample ToDo app configured with Thundra & Sidekick and a live stack trace provided by Thundra.
Conclusion
In this article, I have discussed the importance of remote debugging production environments and how to integrate Sidekick with a Python project. Sidekick resolves a burning problem in monitoring and debugging live environments. It has introduced non-breaking breakpoints (tracepoints), and developers can monitor application status without pausing the application workflow.
I hope this article will help you improve the remote debugging of your applications and improve the productivity of your development work. Thank you for reading!
Originally published at runsidekick.com.