

Sidekick allows you to collect stacks as errors happen, without needing for putting a tracepoint beforehand
Sidekick is an open-source live application debugger that lets you troubleshoot your applications while they keep on running. It is like Chrome DevTools for your and built for everyone who needs extra information from their applications.
[GitHub - runsidekick/sidekick: Free and open-source live application debugger. Like chrome dev…
Sidekick is a live application debugger that lets you troubleshoot your applications while they keep on running. Add…github.com](https://github.com/runsidekick/sidekick "github.com/runsidekick/sidekick")
Sidekick Actions ( logpoint and tracepoint ) are giving developers dynamic logging and live debugging abilities. They are most powerful when you know exactly where you should put them.
Our recent user research shows that when uncaught exceptions occur, proactively putting tracepoints for stack collection might not be enough as in some rare cases, putting a tracepoint after spotting a problem can’t help until the error happens again. That’s why we have developed;
Automatic error stack collection
With our Node agent’s latest update, developers can now activate automatic error stack collection and start collecting exception call stacks from their running applications without stopping them.
Simply we can describe this new feature as an always on tracepoint that is looking out for uncaught exceptions. Of course this can bring an overhead but we see a great potential to lower MTTR’s for exceptions.

See it in action:
We will be using our quickstart repository from a previous tutorial.
[GitHub - boroskoyo/sidekick-nodejs-quickstart: Quick start example for Sidekick.
Sidekick is a live application debugger that lets you troubleshoot your applications while they keep on running. Add…github.com](https://github.com/boroskoyo/sidekick-nodejs-quickstart "github.com/boroskoyo/sidekick-nodejs-quicks..")
The only difference will the 2 new parameters we are adding at the initialization. errorCollectionEnabled is set true to enable the basic error collection and the latest parameter is set true to enable detailed frame capturing in case of errors.

app/app.js
To show an example of uncaught exception we will add
throw new Error(‘yet another error’);
at the end of the function.
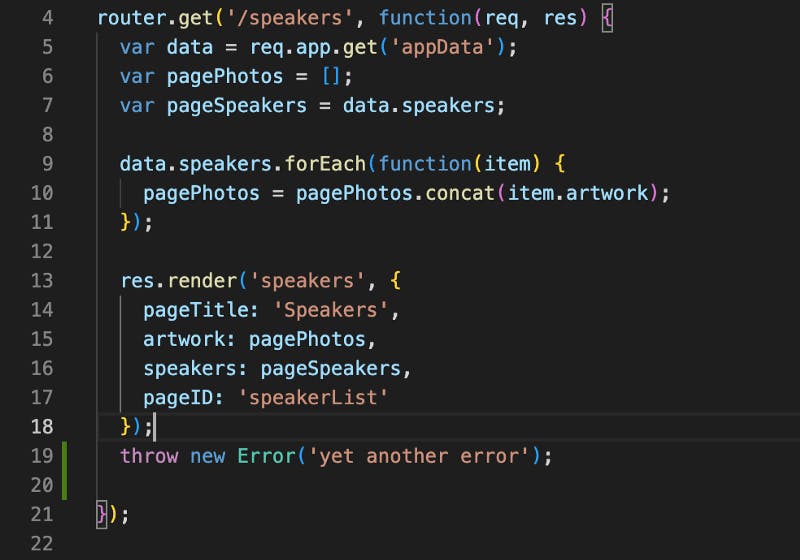
routes/speakers.js
Now then we run our application and visit the speakers page it will throw an exception. It is time to collect information about this exception. For this tutorial we will be using our Sidekick Node.js Client and visualisation of collected errors will soon come to our Web IDE and extensions. You can get our client from:
[@runsidekick/sidekick-client
Node.js client for Sidekick. Send your Sidekick logs and traces to any target in seconds! Explore the docs " Sidekick…npmjs.com](https://www.npmjs.com/package/@runsidekick/sidekick-client "npmjs.com/package/@runsidekick/sidekick-cli..")
Below you can see a simple script to collect error snapshots and print them to console. Sidekick client allows you to customize your ingest functions, check out our recipes page for examples.
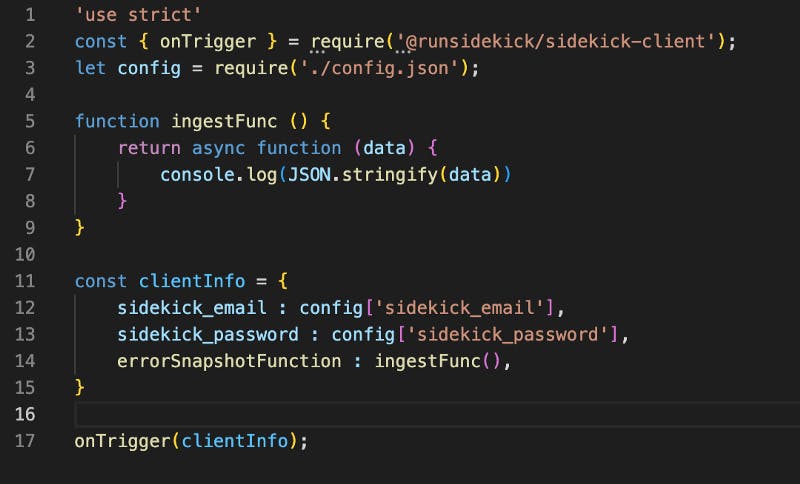
client script
We have started both our main application and client script. After visiting the speakers page our app throw an exception and the agent sent every single detail about it to our broker.
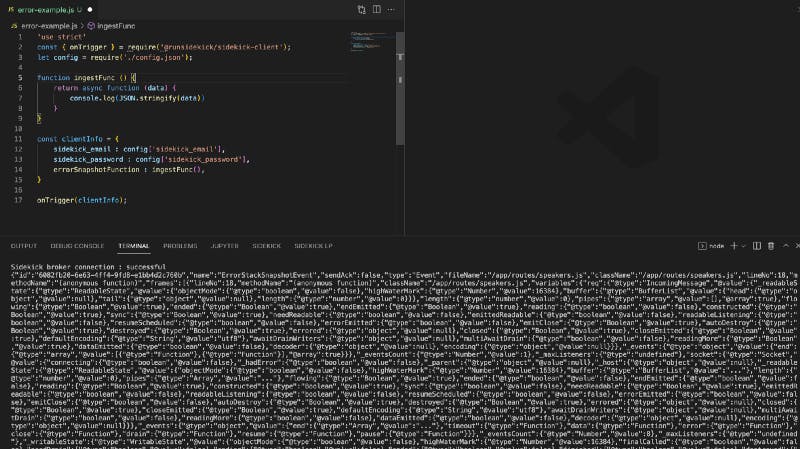
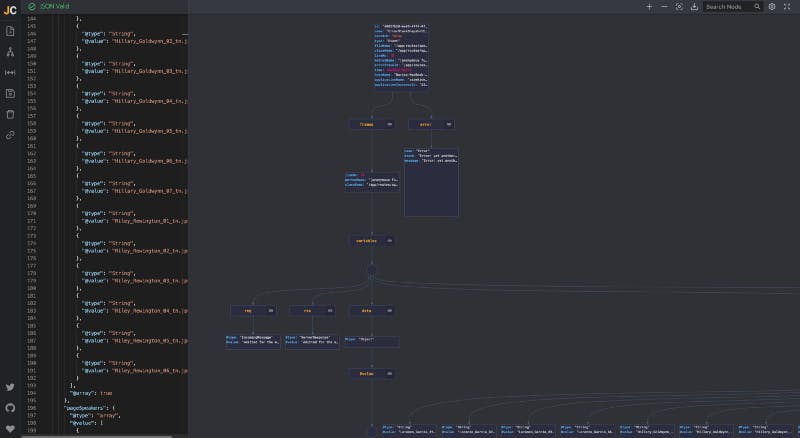
To keep the tutorial simple we have printed everyting to console but to make thing a little bit prettier we will use JSON visualization tool called JSON Crack to understand our collected data. In your own cases sending the collected data to your elastic instances or any other alternative would be much better way to use this data.
[JSON Crack - Crack your data into pieces
Simple visualization tool for your JSON data. No forced structure, paste your JSON and view it instantly.jsoncrack.com](https://jsoncrack.com/ "jsoncrack.com")
Below is the initial node of our collected data. You can see when and where it happened and other details like the error message, file name, line no etc.
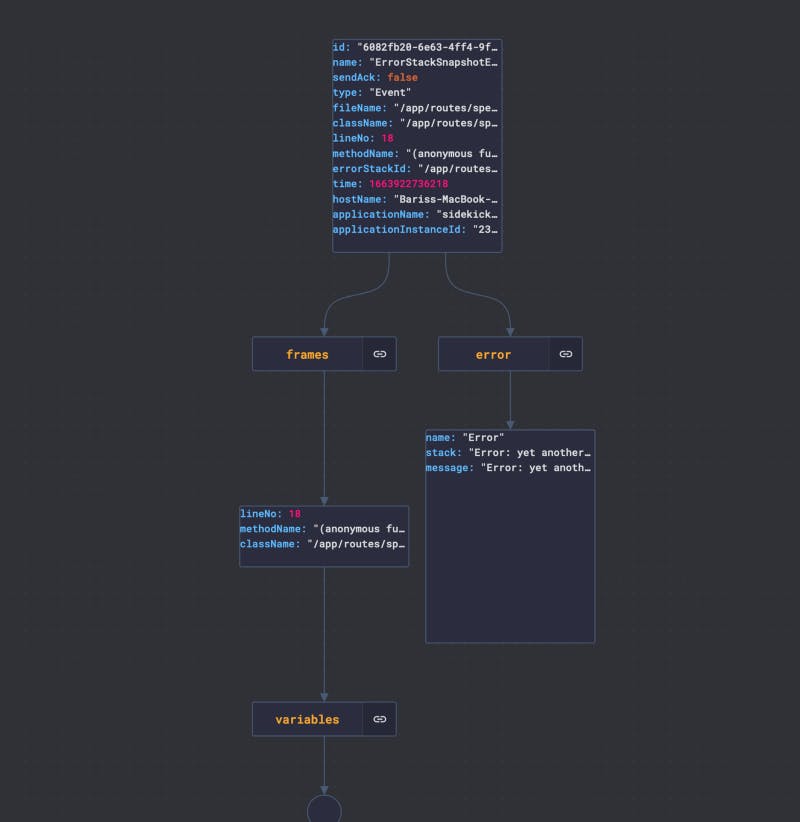
Since we have enabled frame capture we were able to collect every information in our scope. So as you can see below in case of an error, rather than trying to reproduce it or looking out for clues we are now able get everything we need automatically.
All thanks to Sidekick error stack collection
If you would like to ingest this collected data to your desired target you can use Sidekick’s integrations (Logz.io, Slack, Sumo Logic etc.) or see the examples below to learn how you can build your own.
[GitHub - boroskoyo/sidekick-elastic: send your collected tracepoint & logpoint events to…
Sidekick is a production debugging and on-demand logging tool where you can debug your running applications while they…github.com](https://github.com/boroskoyo/sidekick-elastic "github.com/boroskoyo/sidekick-elastic")
[GitHub - boroskoyo/sidekick-loki: Ingest your Sidekick logs & snapshots to Loki. Thanks to winston…
Sidekick is a production debugging and on-demand logging tool where you can debug your running applications while they…github.com](https://github.com/boroskoyo/sidekick-loki "github.com/boroskoyo/sidekick-loki")
TLDR;
With Sidekick Node agent’s latest update, developers can now activate automatic error stack collection and start collecting exception call stacks from their running applications without stopping them. A great addition to Sidekick Actions that will help you boost your developer productivity even more.
Sidekick is open-source and brings almost no overhead to your applications. Visit runsidekick.com to meet your new live application debugger.
[Sidekick | Open Source Live Application Debugger
" Sidekick takes debugging a step further by pinpointing issues at a glance." Sidekick is one of the great ways to…runsidekick.com](https://www.runsidekick.com/ "runsidekick.com")
Please let us know your invaluable ideas because they will guide us on our path to discovering the future of application observability. You can get in touch with us through Twitter, and join our Discord community.