

Photo by Timothy Dykes on Unsplash
Bringing the simplicity of print() to production debugging using PyCharm
The way we develop software evolves, way we debug can’t stay the same!


Writing clean and readable code, adding tests and everything is a must for today’s software development teams but it is never enough to avoid bugs from appearing.
As it is explained in Fireship’s latest video, the best way to avoid writing bugs is to avoid writing code.
You might think having a QA team or constantly testing your software is enough but the tweet below is a great example of what you will experience in the real life:
Even though the way we structure our code or develop architectures changes, anomalies, and bugs are here to stay. So we should start by accepting that fact and find ways to better debug experiences.
Encyclopedia.com defines debugging as
“The identification and removal of localized implementation errors — or bugs — from a program or system.”
So the first step is to identify the errors. This is why we have debuggers and thankfully Python ecosystem has a vast number of debugger alternatives. In this article I’ll explain you fundamental debugging tools for Python and new ways to debug your Python applications in production with the comfort of your PyCharm instance.
A Sea Full of Debugging Solutions
There are plenty of solutions for debugging Python applications. Below I’ve listed a few that I’ve found remarkable.
Good ol’ print()
It wouldn’t be fair to publish this article without paying homage to our old friend, print(). It has been a puppy love for all of us and it is by far the easiest one to start with.

Sadly, when code gets complicated over time, print() falls short as we need a more sophisticated arsenal to find the root cause of production bugs.
Check out the article below to learn more about its drawbacks:
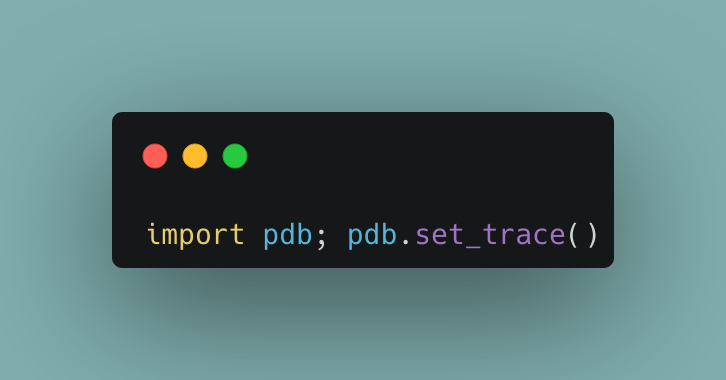
pdb
Python comes with its own debugger called pdb that allows you to start a debugging session with an interactive console to inspect your code while it runs. Furthermore, it also allows you to add a breakpoint to your code and inspect stack frames on the go.
In addition to the points above, pdb is easily extendable as is implemented as a class in the standard Python library.
In short, pdb is powerful and easy to use, especially for small to medium-sized projects. One major drawback of using it in production is that you need to edit your code every time you want to debug your application, which in the end will require a redeploy and restart of your application.
Below you can find extra information about pdb:
IDE Debuggers
Many IDEs like Visual Studio Code & PyCharm offer ways to visually debug your Python applications. They provide an easier and more efficient way of debugging
Debugging using IDE’s default debugger is usually the go-to way at the early stage of projects. They are more than enough for daily debugging with the only drawback of lacking real-time data.
Since traditional debuggers work with the code in your local, they require you to reproduce the buggy scenarios locally. For such scenarios where you can’t reproduce, need real-time data, and debug a remote application remote debugging is the way to go.
PyCharm Remote Debugging
Remote debugging is one of PyCharm’s most powerful features that enable IDE to connect running instances on remote servers. This lets you put breakpoints to your running applications just like you do in a local system.
PyCharm Remote Debugging and other IDE-provided remote debugging alternatives are great to collect data from remote applications but they require additional setup and can be a major source of lag when used in production.
Read more :
For cases when you want to collect stack and exception data and add new logs on-demand to your production & pre-production applications live application debuggers are here to help.
Live application debuggers offer a smoother and more lightweight debugging experience that enables you to collect data from running applications without compromising performance.
One of those live application debuggers is Sidekick. It is open-source and in addition to having traditional features like adding logpoints and putting breakpoints it is packed with extra features like stack collection when an exception occurs and integrations to ingest collected data to targets you desire like Elastic and Loki.
PyCharm Sidekick Plugin
Sidekick PyCharm plugin brings live debugging features to PyCharm making remote debugging hassle-free and lightweight. Enabling developers to debug their Python applications remotely from the comfort of their IDE. Unlike PyCharm remote debugging it is easier to setup, brings near zero overhead, and comes with extra features.
Sidekick brings simplicity of print() to production debugging using PyCharm
Sidekick’s features include:
Tracepoints
A tracepoint is basically a non-breaking remote breakpoint. Tracepoints differ from ordinary breakpoints in two ways:
- First, it doesn’t pause the code execution but just takes a screenshot of the variables when the code hits that line.
- Second, it’s integrated with Thundra’s distributed technology enabling the connection between several tracepoints in the same transaction.
Logpoints
Logpoints are points that you can add to your running application, just like Tracepoints, for adding logs dynamically.
Since you can add and remove your logs at any time, getting the log wherever and whenever you need it becomes a walk in the park!
Exception Stack Collection
With Sidekick Python agent’s latest update, developers can now activate automatic error stack collection and start collecting exception call stacks from their running applications without stopping them.
Simply we can describe this new feature as an always-on tracepoint that is looking out for uncaught exceptions.
Read on:
Data Redaction
Sidekick agents let you define custom redaction functions that run every time before sending any data to Sidekick. This way you get full control over your data.
You can find the Sidekick PyCharm plugin here:
Sidekick does everything above and more while adding near-zero overhead to your applications. No redeploy and restart is needed to start collecting new data. This makes it a perfect tool for a production environment, a true sidekick that you can trust.
One more thing…
It is open-source!
Sidekick and its agents bring a lot to the table and promise to improve the developer experience by far. Furthermore, they are completely open-source so you can both learn how they work, expand them, and self-host your own instances.
You can check out the repository here:
Worth mentioning:
Visual Studio Code
Visual Studio code also has great modern debugging tools and we will further discuss it in another article. In addition to its tools Visual Studio Code also has a Sidekick plugin itself, which you can find here: https://marketplace.visualstudio.com/items?itemName=Sidekick.sidekick-debugger
tldr;
Whether your apps are running on a single EC2, docker or a large k8s cluster, Sidekick allows you to collect realtime stacks, logs and errors from your running applications. All without leaving your favourite IDE.
You can get in touch with us through Twitter, and join our Discord community.