

Sidekick Recipes #2: Add missing logs to your running microservices and send them to Loki.


Sidekick is a production debugging and on-demand logging tool where you can debug your running applications while they keep on running. Sidekick provides the ability to add logs and put non-breaking breakpoints in your application code which captures the snapshot of the application state, the call stack, variables, etc.
This recipe aims to help you send your collected tracepoint & logpoint events to your own Loki instances.
Researching through the vast resources and of course your experiences, you can come up with many best practices for logging your application. Logs are a great starting point for understanding issues and seeing how your application works.
When it comes to microservices it gets even more crucial as this type of architecture makes you tame not one but many different services & their states. Whats more, having missing logs and/or trying to gather extra information by adding new log lines to such systems extra effort and time. Especially when you need to redeploy & restart your apps.
In this recipe, we will go through how Sidekick makes it easier to add new logs to multiple services without rebooting & redeploying and how you can start sending your Sidekick Logs to a Loki instance. We will be using my go-to logging solution for Node.js; ‘winston’ and its ‘winston-loki’ add-on to send our data to Loki.
Part 1: Working with microservices using Sidekick
Sidekick agents are platform agnostic & they can run anywhere your app can run. So from a docker container to a Kubernetes pod or just an npm run start on your local machine, you can bring Sidekick to your production environment.
Sneak peek:
We have recently conducted a performance benchmark and the results are unsurprisingly reassuring. Not only Sidekick does not add any overhead itself (with no logpoints and tracepoints whatsoever), but it also does not bring a significant latency event when it is used in a scenario where a tracepoint gets hit 1000 times in a row. We will publish our benchmark pretty soon.
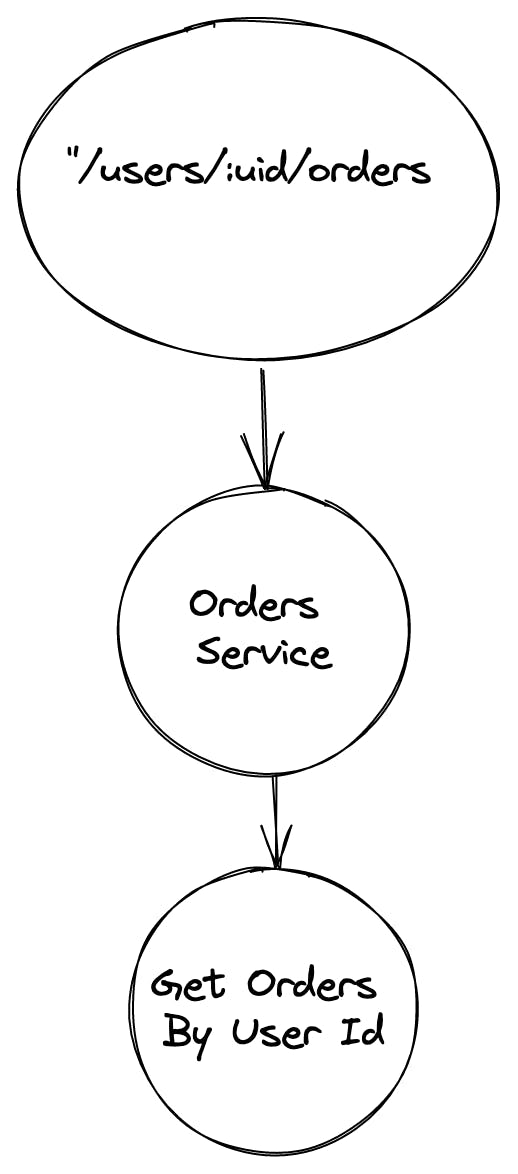
In this example, we’ll be using our local machine and our system consists of two services. Users & Orders. They communicate through HTTP requests and some events like gathering all orders of a user request require those two to communicate with each other.
Our example code is based on Nomercy10’s work at: https://github.com/Nomercy10/ecommerce-micro-services
Service 1: Users
This is the service that includes the user-related endpoints. Below is the endpoint where it communicates with the Orders service.
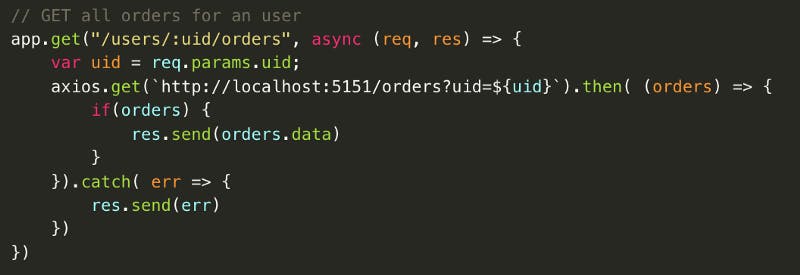
Users.js code snippet
Service 2: Orders
This is the service that includes the order-related endpoints. Below is the endpoint called by Users service.
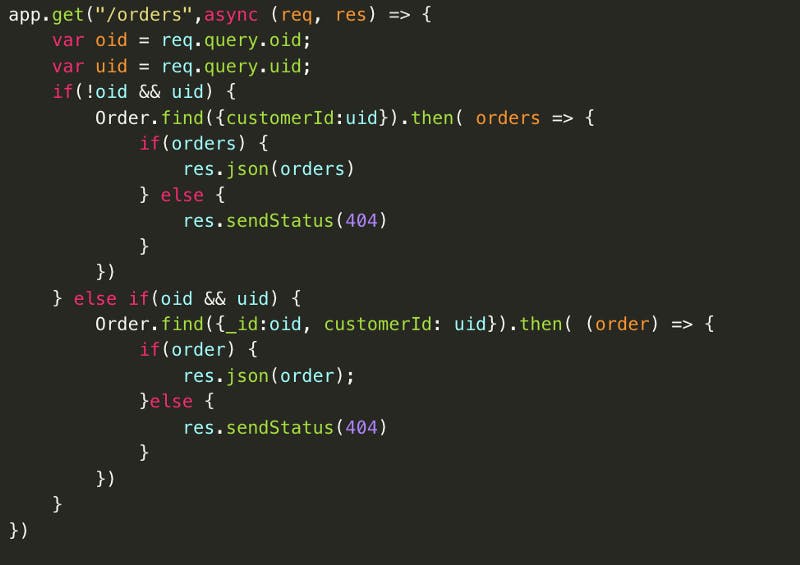
Orders.js code snippet
Simply the flow will be as below:
Install the Sidekick agent
Before we start, let’s install the Sidekick agent for both services. You can get related info here: https://docs.runsidekick.com/installation/installing-agents
require('dotenv').config();
const SidekickDebugger = require('@runsidekick/sidekick-agent-nodejs');
SidekickDebugger.start({
    apiKey: process.env.sidekick_apikey,
    applicationName: "orders service",
    logLevel:'info'
});
We will add the snippet above to both services’ entry points.
Run the Services
After running both now we can see both services’ names on app.runsidekick.com . This was the latest restart needed for the whole process 😉 Procedures below are the same for both Sidekick Web IDE and Sidekick VSCode & IntelliJ IDEA extensions.
Learn more: https://docs.runsidekick.com/plugins/visual-studio-code-extension-python-and-node.js
Adding our Logs
Now it’s time for adding our missing logs.
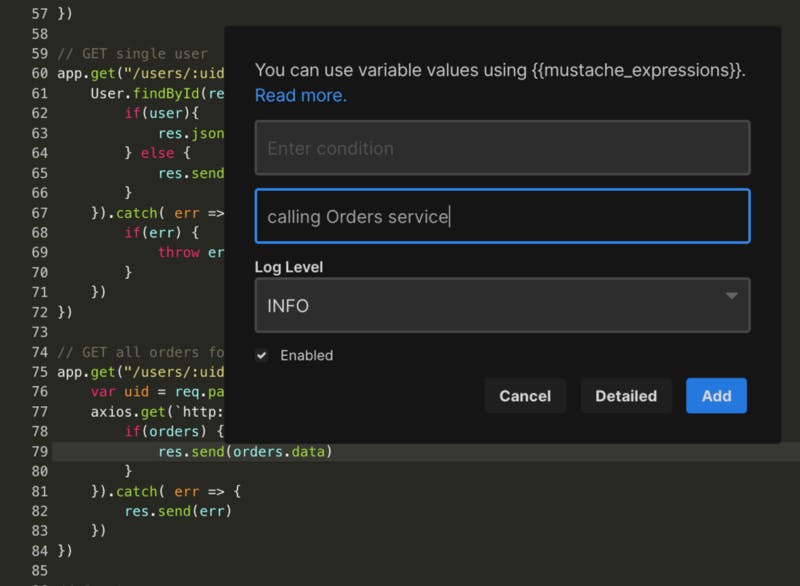
PS: Sidekick now allows you to decide the enabled/disabled status your new tracepoints/logpoints while you are putting them.
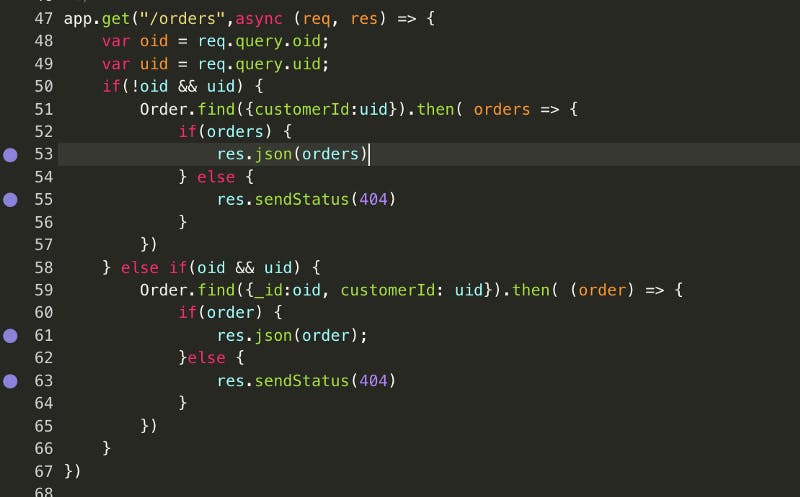
Lines with tracepoints will have a purple indicator at their gutter
Finally, our log points and tracepoints list look like this:
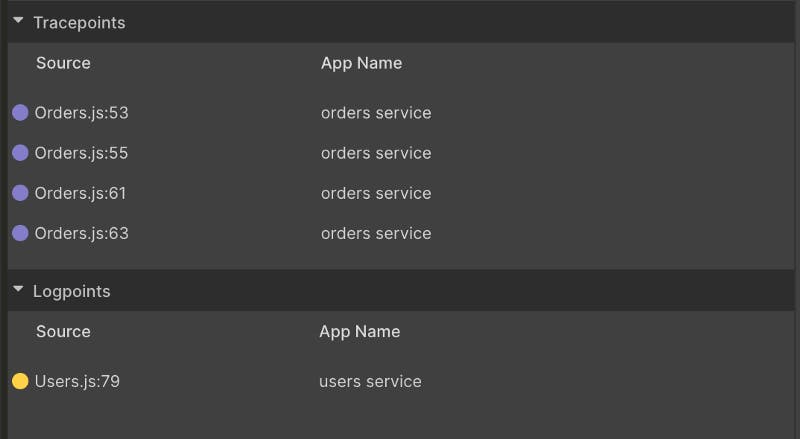
Sidekick Actions list
Now whenever we trigger one of those lines, the related logpoint/tracepoint will run and generate the related event.
Getting the Data Out of our Sidekick Actions
Lets make a get request to localhost:5050/users/62e145f2905a985427dff8.. and trigger the Users.js:79 logpoint and see what it generates.
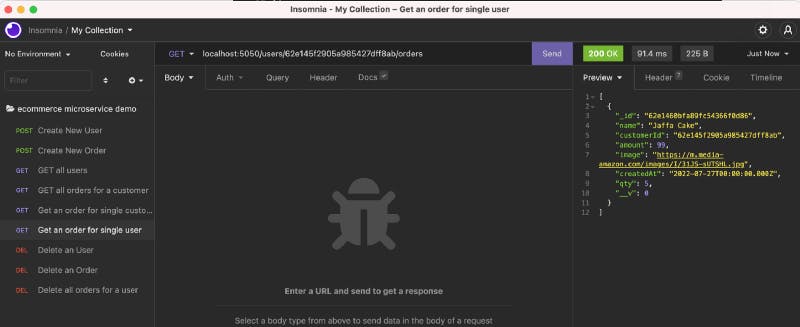
insomnia interface
Our first log is here:
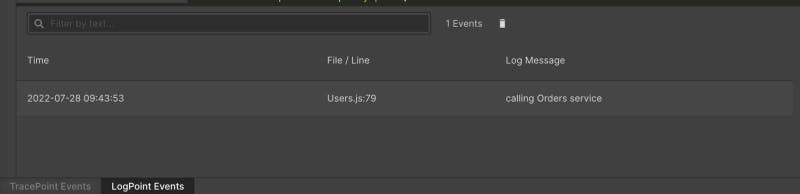
Collected logs
Now let’s observe which tracepoint has hit and see the generated snapshot.
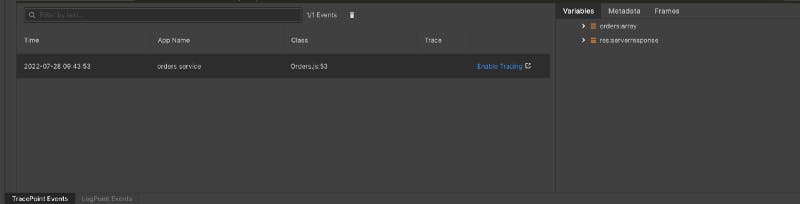
Collected snapshots
Note: If you are not seeing your expected variables, you can expand the depth size to get your desired information. https://www.npmjs.com/package/@runsidekick/sidekick-agent-nodejs
As a result now we have added both a logpoint and tracepoints to our services and we can see which line of code is triggered when a certain endpoint is called.
Part 2: March, march to Loki!
Now that we know how to collect missing data from our applications using Sidekick, let’s see how easy it is to send them to Loki.

Photo by Mildly Useful on Unsplash
This process is similar for all targets. You can also see our first recipe which feeds Elasticsearch with logs here: https://medium.com/runsidekick/sidekick-recipes-1-elasticsearch-ingest-561d0970c030
First, we get our Sidekick Node.js client from here: https://github.com/boroskoyo/sidekick-client-node
Then after filling our credentials as it is explained in the repo’s README, we should install the winston and winston-loki packages.
Winston: https://www.npmjs.com/package/winston
winston-loki: https://www.npmjs.com/package/winston-loki
Now we are good to go! We can start ingesting our logs just by setting up our logger and implementing our ingest function like the below:
const options = {
  transports: [
    new LokiTransport({
        host: 'https://logs-prod-eu-west-0.grafana.net',
        json: true,
        basicAuth: process.env.loki_auth,
        labels: { job: 'sidekick-logs' }
      })
  ]
};
const logger = createLogger(options);

function ingestFunc () {
    return async function (data) {
        logger.info(JSON.stringify(data));
    }
}
and the final script will be:
`require('dotenv').config();
const { createLogger, transports } = require("winston");
const LokiTransport = require("winston-loki");
`const { onTrigger } = require('sidekick-client')`;

const options = {
  transports: [
    new LokiTransport({
        host: 'https://logs-prod-eu-west-0.grafana.net',
        json: true,
        basicAuth: process.env.loki_auth,
        labels: { job: 'sidekick-logs' }
      })
  ]
};
const logger = createLogger(options);

function ingestFunc () {
    return async function (data) {
        logger.info(JSON.stringify(data));
    }
}

const sidekickClient = {
    sidekick_host : process.env.sidekick_host, //this is not mandatory if you are wokring with Sidekick Cloud
    sidekick_email : process.env.sidekick_email,
    sidekick_password : process.env.sidekick_password,
    tracepointFunction : ingestFunc(), //you can also write a seperate function to ingest your snaphots
    logpointFunction : ingestFunc(),
    stdout : false, // enable console log
}

`onTrigger`(sidekickClient);`
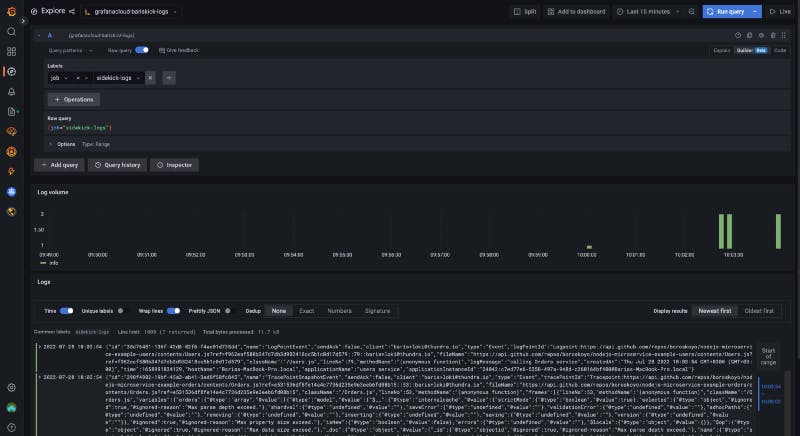
And voilà! You can now ingest your Sidekick logs & snapshots to your Loki instance.
Conclusion
With Sidekick, you can easily add logs to your running applications and feed the results to any target you want. You can get the Sidekick-Loki ingesting script from here: https://github.com/boroskoyo/sidekick-loki
Please let us know your invaluable ideas because they will guide us on our path to discovering the future of application observability. You can get in touch with us through Twitter, and join our Discord community.
Related Links:
https://grafana.com/oss/loki/
https://www.runsidekick.com/